The scale of corporate tax avoidance
Tax deficits and the income shifting of U.S. multinationals
Summary
This paper argues that macroeconomic estimates of tax evasion by multinationals are not representative of the typical multinational firm because aggregate figures are inevitably weighted by firm size. The authors thus use firm-level accounting data to re-investigate prior estimates in the literature of tax evasion by publicly traded US multinationals (Wright and Zucman 2018, Clausing 2016). In particular, they provide estimates of four measures of tax avoidance: foreign effective tax rates, foreign tax deficits, profits shifted out of the U.S., and U.S. tax deficits resulting from profit shifting.
Their microeconomic data allow them to explore the heterogeneity of the results across firms. The authors first find that, although their aggregated firm-level data match the declining trend in foreign effective tax rates observed with macroeconomic data, this decline is highly concentrated in large and highly-profitable firms. Dyreng, Hills, and Markle then produce estimates of the foreign tax deficit for each firm each year. The foreign tax deficit is computed as the difference between aggregated taxes effectively paid to foreign governments and what the corporation would have paid to foreign governments if all its foreign profits were subject to the (weighted) average statutory tax rate of the non-zero rate jurisdictions in which it is active. Again, the steady increase in the foreign tax deficit observed at the aggregated level is consistent with the figure obtained by Wright and Zucman (2018) using macro data. However, micro data show that more than half of the total foreign tax deficit over the sample period comes from 10 companies, the pharmaceutical and technology industries making the largest shares of it.
The authors finally estimate the amount of income shifted out of the Unites States by U.S. multinationals as well as the resulting tax revenue loss. They estimate that aggregate profits shifted out of the United States in 2012 amounted to $107 billion, with an associated tax revenue loss of $37.4 billion for the U.S. tax administration. This is less than half of the lower bound of $77 billion found by Clausing (2016). Analysing how outbound shifted income and tax deficits are distributed across U.S. companies, they find that 10 firms, mainly in the pharmaceutical or technologies industries, are responsible for more than half of the aggregate outbound shifting and the associated U.S. tax deficit.
Key Results
- As highlighted in prior research, the authors observe a downward trend in foreign effective tax rates from 1996 to 2020. The foreign effective tax rate of the 25% of firms with the highest pretax foreign income has decreased from 33% to 17%.
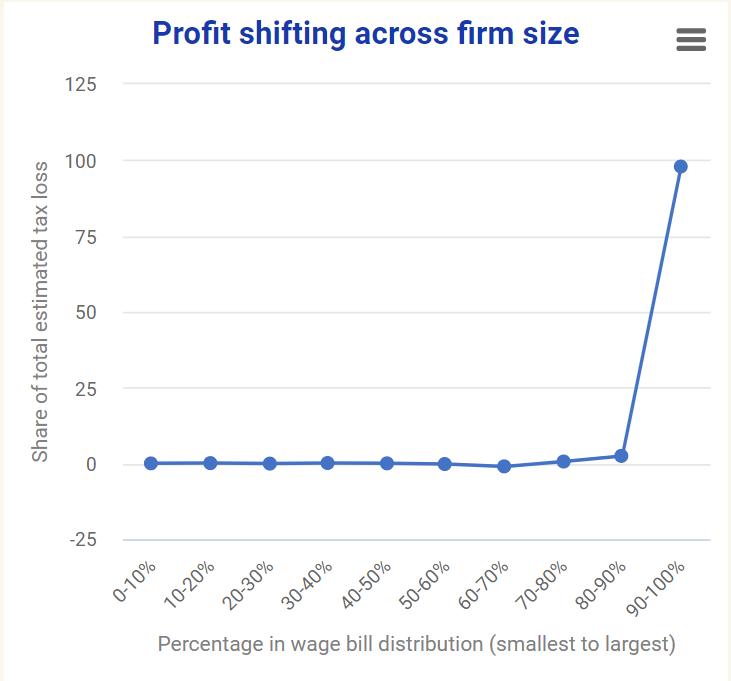
- The strong downward trend in effective tax rates is driven by a few very large and highly-profitable firms.
- 51% of the U.S. multinationals’ total foreign tax deficit is attributable to ten firms only.
- Aggregate profits shifted out of the U.S. amounted to $107 billion in 2012, with an associated tax deficit of $37.4 billion. A small number of firms, mainly in the pharmaceutical and technologies industries, account for most of the shifted profits.
Policy recommendation
Public policies implemented to fight income shifting should consider heterogeneity across firms as these measures could lead to significant costs for smaller, less profitable firms. Moreover, policies targeting specific industries may be appropriate as profit shifting appears to be concentrated in the pharmaceutical and technologies sectors.
Data
The authors use publicly available consolidated financial statements from Compustat. Their primary sample consist of publicly traded multinationals in non-regulated industries and incorporated in the United States. To select into the sample, these firms must have revenues and assets greater than $10 million, foreign pre-tax income over $1 million and non-negative foreign current expenses. Their sample covers the period from 1996 to 2020 and represents 94% of the total income of U.S. multinationals in Compustat. Since all foreign data are aggregated into one reported number in their dataset, the authors use additional disclose of names and locations of companies’ significant subsidiaries to estimate allocations of sales and profits across foreign countries.
Methodology
- The authors compute foreign effective tax rates and the foreign tax deficit for each firm each year. The foreign tax deficit is computed as the difference between aggregated taxes effectively paid to foreign governments and what the corporation would have paid to foreign governments if all its foreign profits were subject to the (weighted) average statutory tax rate of the non-zero rate jurisdictions in which it is active.
- To estimate the amount of outbound shifted profits, the authors use an OLS regression to estimate the semi-elasticity of foreign pre-tax income with respect to the weighted average foreign tax rate faced by the firm. The obtained semi-elasticity allows them to estimate the hypothetical distribution of profits that would prevail if all countries had a uniform tax rate of 30%, i.e. in the absence of profit shifting incentives.
Go to the original article:
The working paper, released in March 2022, can be downloaded from the SSRN website. [PDF]
This might also interest you
Profit shifting, employee pay, and inequalities: evidence from US-listed companies
Big and ‘unprofitable’: How 10% of multinational firms do 98% of profit shifting
Welfare effect of closing loopholes in the dividend-withholding tax: The case of Cum-Cum and Cum-Ex transactions


